Course overview.
Our Power BI Beginner to Advanced courses are designed to help you develop your skills at every stage, from learning the fundamentals to working with more advanced data analysis and business intelligence tools. You will learn how to connect to a range of data sources, transform and model data, create reports and dashboards, and turn complex information into clear and meaningful insights.
Through hands-on projects and practical exercises, you will build the knowledge and confidence to use Microsoft Power BI effectively, developing skills that can be applied to real-world business and data analysis tasks.
Delegates join us from Cardiff, Newport, Swansea and across South Wales. Choose a scheduled classroom date at our Bridgend training venue, join live online, or book the Microsoft Power BI course in-house at your own premises anywhere in Wales or the UK.
Who it's for.
These courses are suitable for individuals at a range of skill levels, from those who are new to Microsoft Power BI to more experienced users looking to develop and expand their knowledge. They are ideal for data analysts, business professionals, managers, and anyone looking to improve their skills in data analysis, reporting, and visualisation. Whether you are learning the fundamentals or exploring more advanced features, our Power BI courses provide practical skills to help you analyse data and make informed decisions with confidence.
What you'll learn.
Depending on your chosen course level, you will learn how to connect to and prepare data, create effective reports and interactive dashboards, use data modelling techniques, build calculations and measures, and apply advanced Power BI features. Through practical exercises and real-world examples, you will develop the skills needed to transform data into meaningful insights and communicate information effectively.
What you'll leave with.
By the end of the day you'll be able to:
- Import and clean data from multiple sources with Power Query
- Build a star-schema data model with correct one-to-many relationships
- Write core DAX measures, including year-on-year comparisons
- Design interactive report pages with slicers, KPIs and drill-through
- Publish reports to the Power BI Service and share them with colleagues
Before you book: Comfortable with Excel: formulas, sorting and filtering. No database or coding background needed. Power BI Desktop is free to download for Windows. Not sure it's the right level? Take the one-minute self-check.
Pairs well with:
Microsoft Power BI Beginner Course overview.
Learn the fundamentals of Microsoft Power BI and discover how to turn everyday business data into clear, useful and interactive reports. This beginner-friendly course introduces the Power BI interface and the complete process of importing, preparing, visualising and presenting data, giving you a practical foundation for modern data analysis and reporting.
You'll work through the process of connecting Power BI to data sources, preparing information for analysis and creating professional reports using charts, tables, cards and interactive visuals. The course focuses on practical examples, helping you understand how Power BI can be used to explore information, identify trends and communicate findings more effectively.
Who it's for.
This course is designed for beginners who are new to Power BI, as well as professionals who work with business data and want to develop modern reporting skills. It's ideal for managers, analysts, administrators, business professionals, finance teams and anyone who needs to turn spreadsheets or other data sources into meaningful reports and dashboards.
No previous Power BI experience is required. Basic familiarity with spreadsheets and working with data is useful, but the course starts with the fundamentals and gradually builds your confidence with Power BI's reporting and visualisation tools.
What you'll learn.
You'll learn how to navigate Power BI Desktop and connect to common data sources such as Excel workbooks and CSV files. You'll explore how to import, clean and organise data, including basic data preparation techniques that help ensure your reports are accurate and consistent.
You'll then learn how to create interactive reports using bar and column charts, line charts, tables, matrices, cards, slicers and other visualisations. You'll discover how to format visuals, apply filters and create interactive report pages so users can explore information and focus on the data that matters to them.
The course will also introduce the fundamentals of relationships, calculated fields and basic DAX, helping you understand how Power BI can be used for more than simple charts. You'll learn how to structure a report, present key findings clearly and create dashboards that make business information easier to understand.
By the end of the course, you'll be able to connect Power BI to data, prepare it for analysis and create professional interactive reports. You'll have a strong foundation for progressing into more advanced Power BI features, data modelling, DAX and business intelligence techniques.
Microsoft Power BI Intermediate Course overview.
Build on your existing Power BI knowledge and develop the skills needed to create more sophisticated reports, work with larger datasets and produce meaningful business insights. This intermediate course takes you beyond basic visualisation and introduces more advanced data preparation, modelling, calculations and interactive reporting techniques.
You'll learn how to combine data from multiple sources, create reliable data models and build reports that allow users to explore information from different perspectives. The course focuses on practical business scenarios, helping you move from simply presenting data to analysing it and using Power BI to support informed decision-making.
Who it's for.
This course is designed for learners who already have a basic understanding of Power BI and want to develop more advanced reporting and data analysis skills. It's ideal for business analysts, managers, finance professionals, administrators, data users and anyone responsible for producing reports or analysing business information.
You should already be comfortable importing data, creating basic visuals and building simple Power BI reports. A basic understanding of Excel and spreadsheet-based data is also useful. The course builds on these skills and introduces more advanced modelling, calculations and reporting techniques.
What you'll learn.
You'll learn how to connect and combine data from multiple sources and use Power Query to clean, transform and prepare datasets for analysis. You'll explore techniques such as removing duplicates, changing data types, splitting and merging columns, filtering information and creating repeatable data preparation workflows.
You'll develop a stronger understanding of data modelling, including relationships between tables, primary and related fields, and how a well-structured model affects the accuracy and performance of your reports. You'll learn how to create calculated columns and measures and use DAX functions for more meaningful calculations and analysis.
You'll also create more advanced interactive reports using slicers, drill-downs, filters, bookmarks, tooltips and cross-filtering. You'll learn how to design report pages with a clear visual hierarchy, allowing users to quickly identify key information while still being able to explore the underlying data in greater detail.
By the end of the course, you'll be able to prepare and model data effectively, create useful DAX calculations and build professional, interactive Power BI reports. You'll have the skills to move beyond basic dashboards and use Power BI as a practical tool for business analysis, reporting and decision-making.
Microsoft Power BI Advanced Course overview.
Take your Power BI skills to an advanced level and learn how to build sophisticated data models, powerful calculations and professional business intelligence solutions. This course builds on your existing Power BI experience and focuses on advanced data transformation, modelling, DAX, performance, reporting and interactive analysis.
You'll learn how to work with more complex datasets and develop robust Power BI solutions that can support real-world business reporting and decision-making. The course moves beyond basic dashboards and explores advanced techniques for building scalable models, creating reusable calculations, improving report performance and presenting complex information clearly.
Who it's for.
This course is aimed at experienced Power BI users who are ready to move beyond intermediate reporting and develop advanced business intelligence skills. It's ideal for data analysts, BI professionals, business analysts, finance professionals, reporting specialists and experienced Power BI users responsible for creating or maintaining complex analytical solutions.
You should already be confident importing and transforming data, creating relationships, building reports and using basic DAX. A good understanding of Power Query and data modelling is recommended, as the course focuses on advanced techniques rather than introductory Power BI concepts.
What you'll learn.
You'll work with advanced Power Query techniques to transform and combine complex datasets, create reusable queries and build efficient data preparation workflows. You'll learn how to structure sophisticated data models, including star schemas, fact and dimension tables, relationship design and techniques for improving model reliability and performance.
A major focus will be advanced DAX. You'll learn how to create sophisticated measures using functions for filtering, context manipulation, time intelligence and advanced calculations. You'll explore concepts such as filter context, row context, CALCULATE, iterators and time-based analysis, allowing you to create calculations that provide much deeper business insight.
You'll also learn advanced reporting techniques, including drill-through, bookmarks, dynamic titles, tooltips, interactive navigation and advanced filtering. You'll explore how to design report experiences that allow users to move from high-level summaries into detailed analysis while keeping complex information clear and easy to understand.
The course will also cover performance optimisation, helping you identify inefficient queries, calculations and data models that can slow down reports. You'll learn practical techniques for improving model structure, reducing unnecessary data and writing more efficient DAX so that your reports remain responsive as datasets become larger and more complex.
By the end of the course, you'll be able to design advanced Power BI solutions from data preparation through to final reporting. You'll have the skills to build sophisticated models, create powerful DAX calculations, optimise performance and deliver professional interactive reports that support detailed business analysis and informed decision-making.
From raw data to dashboard.
Power BI rewards doing things in the right order. Here's the order we teach it in, from connecting your first source to publishing a report people can use. Select any stage to jump to it.
Is this course right for you?
Five quick questions, about a minute. You'll get an honest read on whether Microsoft Power BI fits where you are now, and which parts of the course will help you most.
This course is fully fundable through ReACT+.
If you've been made redundant or are facing redundancy in Wales, the Welsh Government's ReACT+ scheme can fund up to £1,500 toward this course — plus childcare, travel and accommodation expenses. We'll handle the application.
Benefits of Attending This Course
Develop practical Microsoft Power BI skills to transform raw data into meaningful insights through interactive dashboards and reports. Learn how to analyse business performance, communicate findings effectively and support smarter, data-driven decision-making.
What delegates said.
A few examples of the kind of feedback delegates might share after completing our Microsoft Power BI training — turning everyday data into clear, useful reports and interactive dashboards.
I had seen Power BI being used in the workplace but didn't really understand how it all worked. The course broke everything down into manageable steps and gave me the confidence to start building my own reports.
The practical approach made a big difference. I learned how to connect data, create visualisations and build dashboards that are much easier for other people in the team to understand.
One of the most useful data courses I've attended. I particularly enjoyed learning how to turn large amounts of information into simple, interactive reports that can actually support decision-making.
Ascent Training Wales · Bridgend.
Our conference room is purpose-built for effective training — bright, modern, and fully equipped for workshops, seminars and accredited sessions.
Llynfi Enterprise CentreHeol Ty Gwyn Industrial Estate
Maesteg, Bridgend, CF34 0BQ

Turn Data into Insights with Microsoft Power BI
Create Interactive Dashboards
Learn how to build professional reports and dashboards that present business data clearly and support informed decision-making.
Analyse Data with Confidence
Develop practical skills for connecting, transforming and visualising data to uncover trends, patterns and valuable business insights.
Support Data-Driven Decisions
Discover how Power BI helps organisations monitor performance, improve reporting and make faster, evidence-based decisions.
What people get wrong.
Three things we hear before almost every Microsoft Power BI course, and what's actually true.
Power BI is just prettier Excel charts.
Reality
The real power is the model underneath: one set of cleaned, related data that refreshes, so every report tells the same story.
You need to be a programmer to write DAX.
Reality
Most everyday measures are a single line. What you do need is to understand filter context, which we explain with pictures, not jargon.
A good dashboard shows everything.
Reality
The best report pages answer three or four questions well. Everything else belongs behind a drill-through.
Common questions.
Quick answers to what most people ask before booking. Still need help? Get in touch.
How long is the course and where is it delivered?
How much does it cost and what's included?
When is the next date available?
Is this course eligible for ReACT+ funding?
Can you deliver this course in-house for our team?
Do I need a Power BI licence?
Does Power BI work on a Mac?
Is Power BI better than Excel?
From the classroom.
Our Bridgend venue is purpose-built for working learning — bright, modern, configurable for cohorts of four to twelve, with quality AV throughout and free parking right outside.

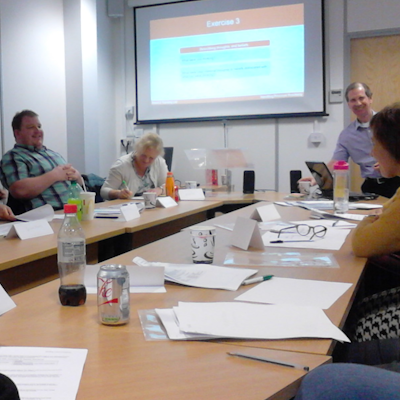


Llynfi Enterprise Centre · Bridgend · More about our venue →
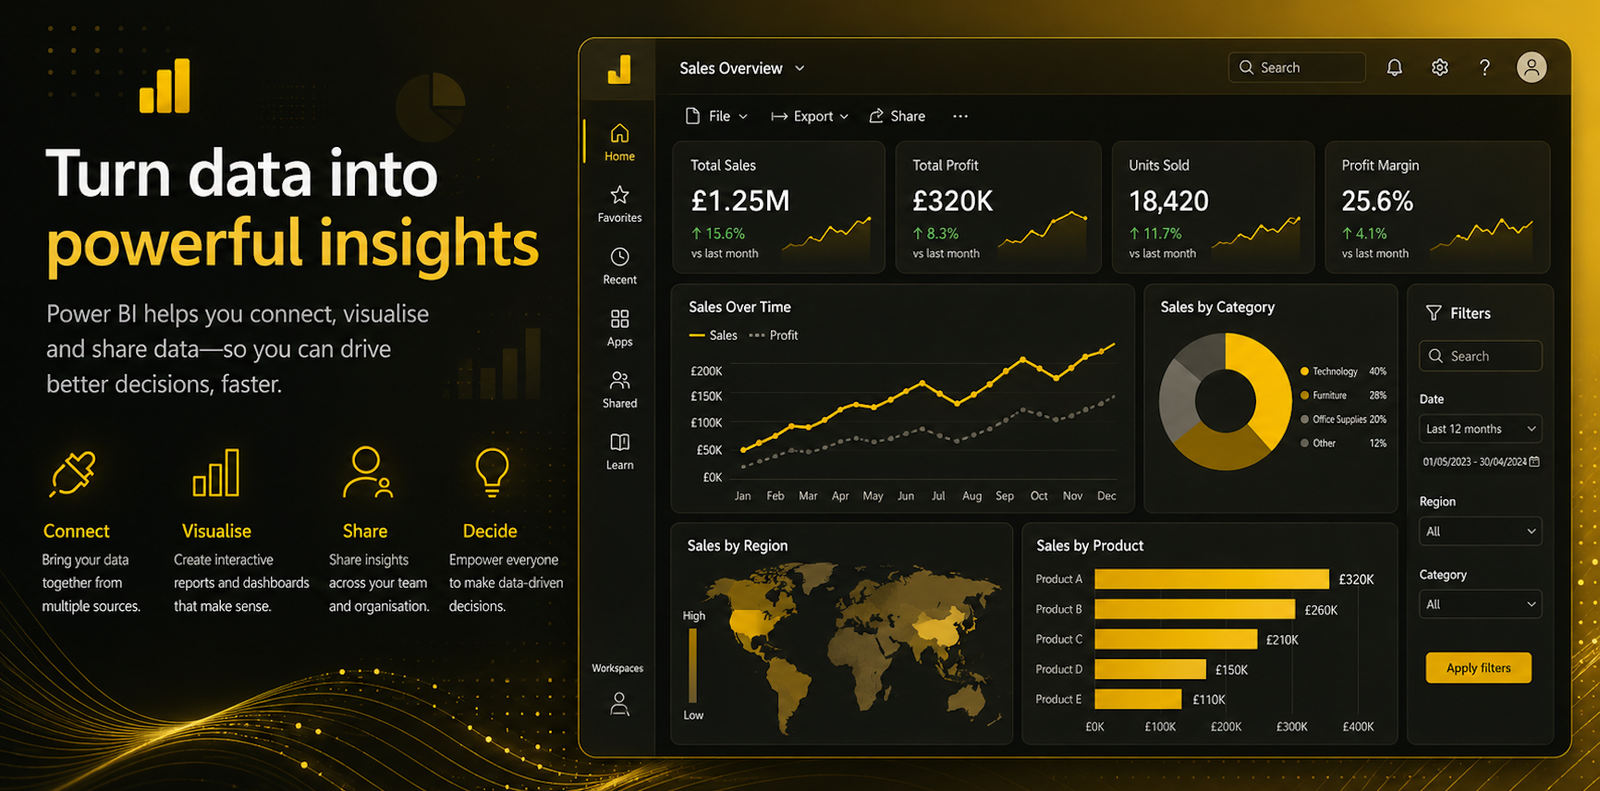
Turn data into insight.
Microsoft Power BI helps organisations turn complex data into clear, interactive and useful insights. This practical course in Cardiff introduces you to the tools and techniques needed to work with data, create meaningful visualisations and build reports that support better business decisions. No advanced technical background is required — just an interest in making better use of data.
Understand Power BI
Learn how Power BI can bring data from different sources together and transform information into clear, accessible business insights.
Connect and prepare data
Discover how to work with datasets, organise information and prepare data so it can be analysed and presented effectively.
Create powerful visualisations
Learn how to use charts, dashboards and interactive reports to communicate trends, patterns and key findings clearly.
Make better decisions
Understand how data-driven reporting can help teams identify opportunities, monitor performance and make more informed business decisions.
Support Welsh workplaces
Develop valuable data skills that can benefit businesses and organisations across Cardiff and Wales, helping teams turn information into practical insight and action.
More in Computing.
Courses that pair well with Microsoft Power BI, or that your team often takes as a sequence.

Ready when you are.
Book Microsoft Power BI for £275 a seat, or send us a brief and we'll come back with a tailored in-house quote for your team within two working days.